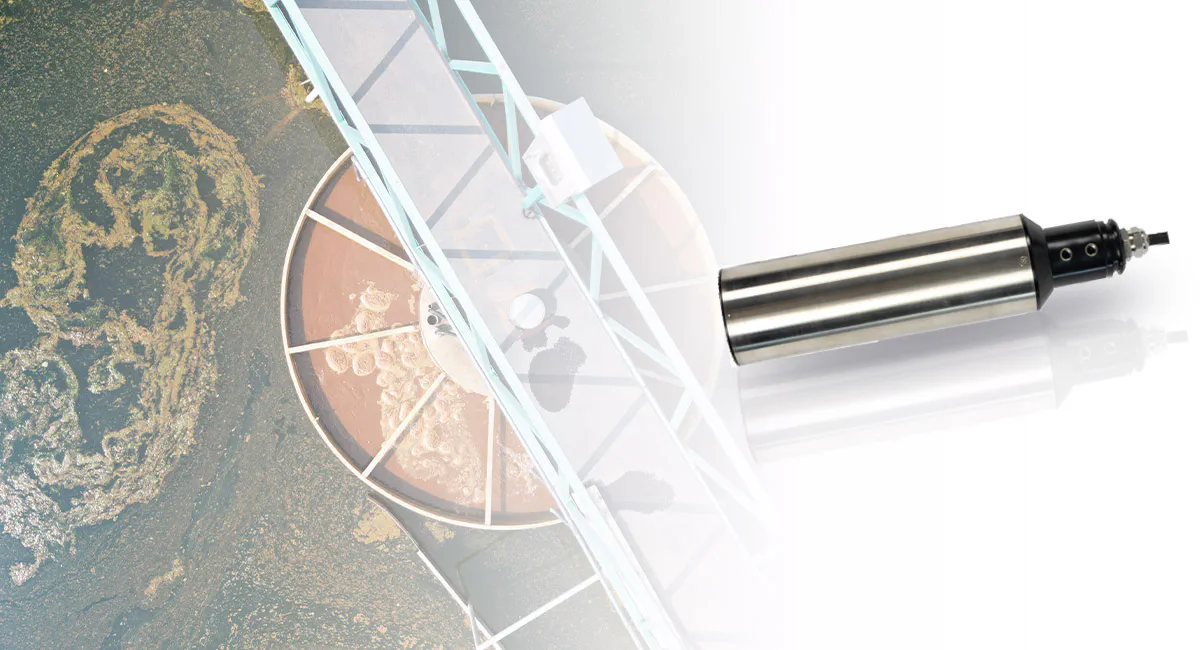
Turbidity Sensor in Industrial Water Monitoring
From Visual Indicator to Process Control Variable
In industrial water systems, turbidity is no longer treated as a simple visual indicator. It has become a process-critical variable that directly affects filtration efficiency, chemical dosing accuracy, equipment protection, and regulatory compliance.
As production processes become more automated and water reuse standards tighten, the role of the turbidity sensor is shifting—from basic compliance monitoring to continuous, decision-driving instrumentation embedded in control systems.
This article examines turbidity sensors from an industrial process perspective, focusing on where turbidity data actually influences operational outcomes, and how engineers should evaluate turbidity measurement strategies in complex water environments.
Why Turbidity Measurement Matters Beyond Compliance
In many industrial sectors, turbidity is monitored not because regulations require it—but because process stability depends on it.
Examples include:
-
Filter breakthrough detection in wastewater and reuse systems
-
Early warning of solids carryover in cooling and boiler feedwater
-
Process water quality control in food, beverage, and pharmaceutical production
-
Protection of downstream analyzers, membranes, and heat exchangers
In these scenarios, turbidity measurement is not an endpoint.
It is an input signal that determines how systems respond in real time.
Turbidity as a Control Variable, Not Just a Water Quality Metric
Treating turbidity as a control variable changes how sensors are selected and deployed.
Instead of asking:
“Can this turbidity sensor measure NTU?”
Industrial users ask:
“Can this turbidity signal be trusted under changing flow, solids composition, and long-term operation?”
This shift places new emphasis on:
-
Signal stability
-
Repeatability under fouling conditions
-
Correlation with actual solids behavior, not just optical clarity
Common Industrial Turbidity Measurement Approaches
Before comparing sensor performance, it is important to understand how turbidity is typically measured in industrial systems.
Main Measurement Techniques in Use
-
90° scattered light (ISO 7027 compliant)
-
Infrared optical turbidity measurement
-
Combined scattered + transmitted light methods
Each approach reacts differently to:
-
Particle size distribution
-
Color interference
-
Air bubbles and biofouling
Typical Turbidity Measurement Ranges by Application
Different industrial applications require fundamentally different turbidity measurement ranges and signal behaviors.
Chart Data (for visualization):
| Application Area | Typical Turbidity Range (NTU) | Measurement Priority |
|---|---|---|
| Drinking water filtration | 0.01 – 5 NTU | High resolution |
| Process water reuse | 1 – 100 NTU | Stability & trend |
| Wastewater secondary effluent | 5 – 300 NTU | Fouling resistance |
| Sludge thickening / overflow | 100 – 1000 NTU | Robustness |
| Industrial cooling water | 1 – 50 NTU | Long-term drift |
This comparison shows why a turbidity sensor optimized for drinking water may fail in wastewater or reuse systems. Industrial environments often prioritize trend consistency and fouling tolerance over ultra-low NTU resolution.
Signal Stability: The Hidden Requirement in Industrial Turbidity Sensors
In real-world installations, turbidity sensors rarely operate under laboratory conditions.
Challenges include:
-
Coating from organic matter or oil
-
Rapid changes in solids composition
-
Flow velocity fluctuations
-
Temperature variation
A sensor that produces accurate readings during commissioning but drifts after weeks of operation introduces false process signals, leading to unnecessary chemical dosing or delayed fault detection.
Causes of Turbidity Signal Instability in Industrial Systems
Most turbidity measurement errors in industrial systems originate from environmental and process-related factors, not sensor electronics.
Chart Data:
| Instability Factor | Typical Impact on Signal | Operational Consequence |
|---|---|---|
| Optical window fouling | Gradual signal increase | False high turbidity alarms |
| Air bubbles | Short-term spikes | Control loop oscillation |
| Particle size variation | Nonlinear response | Poor correlation to solids load |
| Ambient light intrusion | Signal noise | Reduced measurement confidence |
| Temperature drift | Baseline shift | Long-term calibration errors |
Understanding these factors allows engineers to evaluate turbidity sensors not only by specification sheets, but by how they behave after months of continuous operation.
Online Turbidity Sensors vs. Laboratory Measurement
While laboratory turbidity analysis remains valuable for verification, it cannot replace online turbidity sensors in process control.
Online sensors provide:
-
Continuous trend data
-
Immediate response to process upsets
-
Integration with PLC, DCS, and SCADA systems
The value lies not in absolute accuracy alone, but in early detection and process predictability.
Integration with Industrial Control Systems
Modern turbidity sensors are increasingly deployed as part of integrated water quality monitoring platforms.
Key integration considerations include:
-
Digital communication (RS-485 / Modbus)
-
Synchronization with pH, conductivity, and MLSS data
-
Alarm logic based on rate-of-change, not just threshold values
This integrated approach transforms turbidity from a standalone measurement into a decision-support signal.
Selecting a Turbidity Sensor for Industrial Use
Instead of focusing solely on NTU range, industrial users should evaluate turbidity sensors based on:
-
Long-term signal stability
-
Maintenance and cleaning requirements
-
Resistance to fouling and coating
-
Compatibility with existing analyzers and transmitters
-
Proven performance in similar process environments
Final Perspective
A turbidity sensor is no longer just a compliance instrument.
In industrial water systems, it is a predictive indicator, a process safeguard, and a control input.
Selecting the right turbidity measurement strategy directly impacts:
-
Operational efficiency
-
Chemical consumption
-
Equipment protection
-
Overall process reliability