
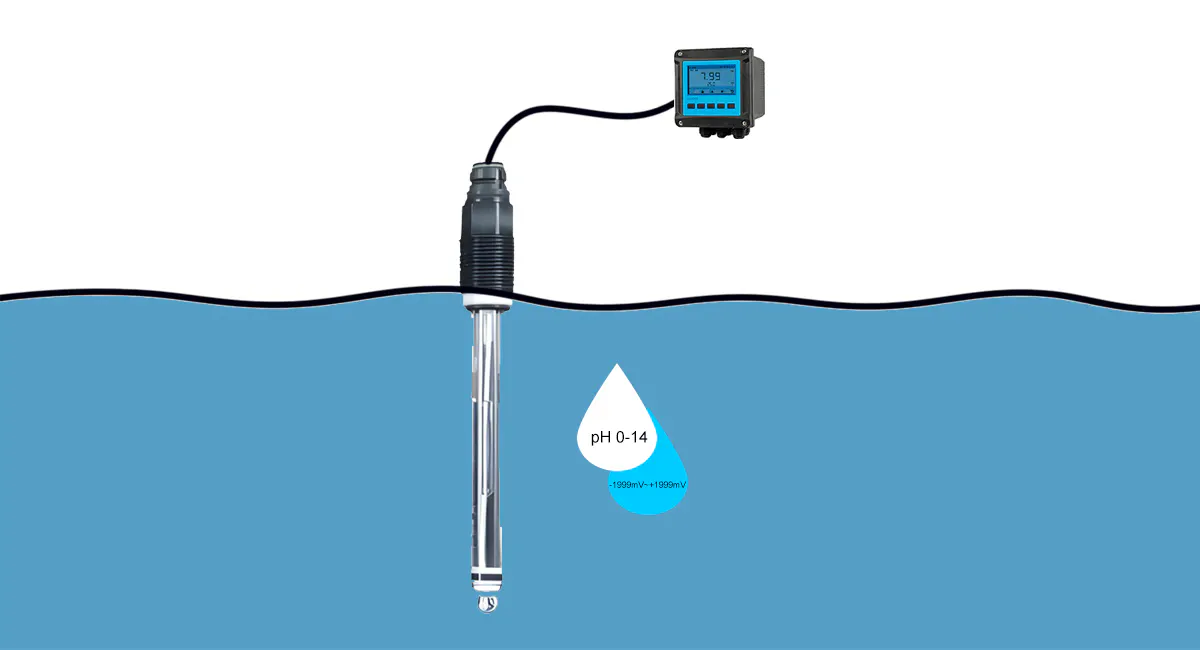
Обслуживание датчиков pH ORP и предотвращение дрейфа
Ensuring Long-Term Stability for Industrial Process Control
Introduction: Why Maintenance Determines Measurement Reliability
In industrial processes, pH and ORP sensors are critical for monitoring water quality, chemical dosing, and process stability. While accuracy specifications are important, long-term measurement reliability is often determined by maintenance practices rather than initial sensor performance.
Unexpected sensor drift can result in:
Process instability
Chemical overdosing or underdosing
Несоблюдение нормативных требований
Increased operational cost
A well-designed maintenance strategy ensures stable readings, longer sensor life, and predictable operational performance.
Understanding Sensor Drift Mechanisms
Drift is not random; it follows predictable patterns related to process chemistry, temperature changes, fouling, and electrode aging.
Взгляд инженера: In wastewater treatment, a reference junction exposed to heavy metal ions can drift 0.03–0.05 pH units per week, creating errors in chemical dosing that propagate through the control system.
Common Causes of pH ORP Sensor Drift
| Drift Cause | Typical Drift Rate | Observable Symptom | Операционный риск |
|---|---|---|---|
| Reference contamination | 0.02–0.05 pH/week | Slow response, offset error | Over/under chemical dosing |
| Fouling buildup | 5–15 mV ORP/week | Unstable readings | Process variability |
| Температурный стресс | ±0.1 pH per 10°C | Сигнальный шум | Колебания контура управления |
| Старение электродов | >10% slope loss over 6–12 months | Calibration failures | Unexpected replacements |
Understanding drift patterns enables predictive maintenance. By identifying early warning signs, engineering teams can schedule cleaning or replacement before process stability is affected.
Cleaning Frequency Must Match Process Conditions
Cleaning too frequently wears out electrodes, while too little cleaning allows fouling to accumulate, affecting measurement reliability.
Сценарий: In municipal wastewater, sensors exposed to high organic solids will accumulate biofilm quickly. Manual cleaning every two weeks is usually insufficient; automatic cleaning systems maintain stable readings and reduce labor.
Recommended Cleaning Frequency by Process Environment
| Process Environment | Typical Fouling Rate | Recommended Cleaning Interval | Expected Sensor Lifetime |
|---|---|---|---|
| Чистая вода | Низкий | 30–45 days | 24–36 months |
| Городские сточные воды | Средний | 7–14 days | 18–24 months |
| Industrial effluent | Высокий | 3–7 days | 12–18 months |
| Sludge / high solids | Очень высокий | Автоматическая очистка | 6-12 месяцев |
Aligning cleaning frequency with fouling severity stabilizes measurements while extending electrode life. Automatic cleaning is particularly valuable in high-fouling processes, minimizing manual intervention and downtime.
Calibration Practices: Confirm Sensor Health, Don’t Mask Problems
Calibration should not be used as a “band-aid” to hide drift. Misinterpreting calibration data can result in hidden degradation and unexpected failures.
Сценарий: A chemical plant noticed a pH sensor slope decline from 100% to 88% over a month. Without trend monitoring, the sensor appeared functional but caused dosing errors, increasing chemical costs.
Key Calibration Indicators for pH ORP Sensors
| Indicator | Normal Range | Warning Threshold | Рекомендуемое действие |
|---|---|---|---|
| pH slope | 95–105% | <90% | Plan electrode replacement |
| Zero offset | ±15 mV | >±30 mV | Inspect reference junction |
| ORP stability | ±5 mV | >±20 mV | Clean electrode / check fouling |
| Temperature compensation | ±0.3°C | >±1.0°C | Sensor inspection |
Monitoring calibration trends provides early warning of electrode aging or reference contamination, allowing maintenance to be scheduled before it affects operations.
Predictive Maintenance Reduces Lifecycle Costs
Maintenance strategy directly affects total cost of ownership (TCO). Predictive maintenance based on real-time sensor data can significantly reduce emergency interventions.
Сценарий: An industrial water treatment plant implemented trend-based monitoring. They extended pH sensor life from 12 months to 24 months, reduced emergency downtime by 60%, and minimized chemical overdosing.
Lifecycle Cost Comparison
| Стратегия технического обслуживания | Sensor Lifetime | Annual Labor Hours | Downtime Events | Relative Cost |
|---|---|---|---|---|
| Реактивный | 6-12 месяцев | Высокий | Частые | Высокий |
| Scheduled preventive | 12–24 months | Средний | Occasional | Средний |
| Predictive (trend-based) | 18–36 months | Низкий | Редкие | Низкий |
Moving from reactive to predictive maintenance not only extends sensor life but also optimizes labor and operational cost, particularly in critical processes.
Maintenance Requirements Depend on Process Severity
The harsher the environment (high solids, aggressive chemicals, wide temperature swings), the more robust the sensor design and the higher the maintenance priority.
Process Condition vs Maintenance Priority
| Состояние | Reference Design | Метод очистки | Maintenance Priority |
|---|---|---|---|
| Low conductivity water | Single junction | Руководство | Средний |
| Городские сточные воды | Double junction | Manual / Semi-auto | Высокий |
| Chemical processes | Chemical-resistant reference | Руководство | Высокий |
| Sludge / high solids | Open junction | Автоматический | Критический |
Selecting the appropriate reference system and cleaning method according to process conditions reduces maintenance frequency, ensures long-term measurement stability, and prevents unexpected operational failures.
Integration with Control Systems Enhances Maintenance Strategy
When sensors are digitally integrated, maintenance teams can receive:
Real-time alerts for drift or fouling
Historical trend analysis
Predictive replacement schedules
This reduces human error and ensures measurement reliability across multiple sites.
Key Takeaways
Sensor drift is predictable; early intervention avoids process disruption.
Cleaning frequency must be matched to fouling rates to optimize sensor life.
Calibration trends provide early warning of degradation.
Maintenance strategy impacts lifecycle cost, labor, and downtime.
Digitally integrated sensors support predictive maintenance and process reliability.